In this post
When a radioactive nucleus decays, the activity of the atom decreases. This activity never reaches zero as there will always be some radioactive material remaining which will decay further. The activity of a radioactive source is measured using the unit becquerel (Bq).
The radioactivity decreases over a period of time but the process of decay is completely random. If we are given a sample of radioactive material, containing millions of atoms, we will not be able to predict when the decay will happen or how many of the atoms will decay. Once an unstable nucleus has decayed, it is not able to decay again. If a graph was plotted of the number of nuclei decaying per second against time for any particular radioactive isotope, it would show that the rate of decay decreases as time increases. This occurs because as time goes on, the number of nuclei that could decay decreases. The time taken for this activity to decrease varies widely depending upon the amount of the isotope present and the conditions under which it is decaying.
Half-life
Although it is not possible to predict when this radioactive decay will occur, it is possible to measure the length of time taken for half of the nuclei of the radioactive sample to decay. This is known as the half-life of the isotope. Each different radioactive isotope has a different half-life. The half-life can be used to work out the rate at which a radioactive source decays, and is measured in becquerels (Bq).
One becquerel refers to one nuclei decaying per second, 1 kilobecquerel (kBq) refers to 1,000 nuclei decaying per second and 1 megabecquerel (MBq) refers to 1,000,000 nuclei decaying per second.

Measuring half-life
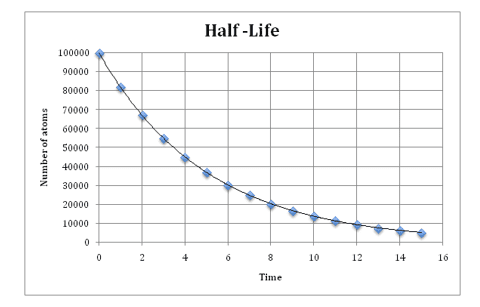
The radioactivity of a sample can be measured and recorded at regular time intervals using a Geiger-Müller tube and a rate meter. These measurements can then be plotted as a graph with time on the axis and activity (or number of radioactive nuclei remaining) on the axis as shown in the diagram below:

The half-life of the sample can then be worked out using the graph. To do this you look at the activity measurement for the sample at 0 time. You then work out what half of the activity would be and read off from the graph, the time at which this activity is reached. For example, in the diagram above the number of atoms at 0 days on the time axis was 100,000. Half of this number of atoms is 50,000 atoms. From the graph we can see that 50,000 atoms were present on 3.5 days. We can therefore say that the half-life of this sample is 3.5 days.
You should be able to use the concept of half-life to carry out simple calculations on activity.
Example
A substance has a half-life of 10 days. There are 20,000 at 0 days. Calculate the number of atoms present after 40 days.
The number of atoms will halve every 10 days.
After 10 days we will have 10,000 atoms.
After 20 days we will have 5,000 atoms.
After 30 days we will have 2,500 atoms.
After 40 days we will have 1,250 atoms.


