In this post
Waves are vibrations (or oscillations) which transfer energy and information, but not matter, through a medium. Waves cause the particles of the medium to oscillate. The oscillations are transferred from particle to particle causing the energy to be transferred. However, the particles themselves do not change their position so matter is not transferred. All waves can be absorbed, transmitted, reflected or refracted when they arrive at a boundary between two different types of medium. The action taken by the waves depends upon their wavelength and frequency and the type of materials involved.
Transverse and longitudinal waves
All waves can be described as either transverse or longitudinal. You must be able to explain the difference between the two types.
Transverse waves can be demonstrated using a slinky spring. Imagine that two people place the slinky spring out onto a flat surface and grab each end to stretch the spring out. They then use a wiggling motion to move the spring from side to side as shown in the diagram.

As shown in the diagram, the vibrations move up and down, whereas the wave moves in a forwards direction.
In transverse waves the movement of the oscillations is perpendicular or at right angles to the direction of the energy or wave movement.
Examples of transverse waves include water waves and s-waves.
Longitudinal waves can also be demonstrated using a slinky spring. Imagine that two people were again holding the slinky at each end. Instead of wiggling the slinky, the two people would take it in turns to push the slinky back and forth. The slinky spring would bunch up and stretch out in different areas as the wave travels down the horizontal length of the spring, as shown in the diagram. This backwards and forwards movement of the spring demonstrates the way in which longitudinal waves move.

In longitudinal waves the oscillations occur parallel to and move in the same direction as the wave moves through the medium. The areas of the spring that bunch up represent the areas of compression in the longitudinal wave. The areas of the spring which stretch represent the areas of refraction in the wave. Examples of longitudinal waves include sound waves and p-waves.
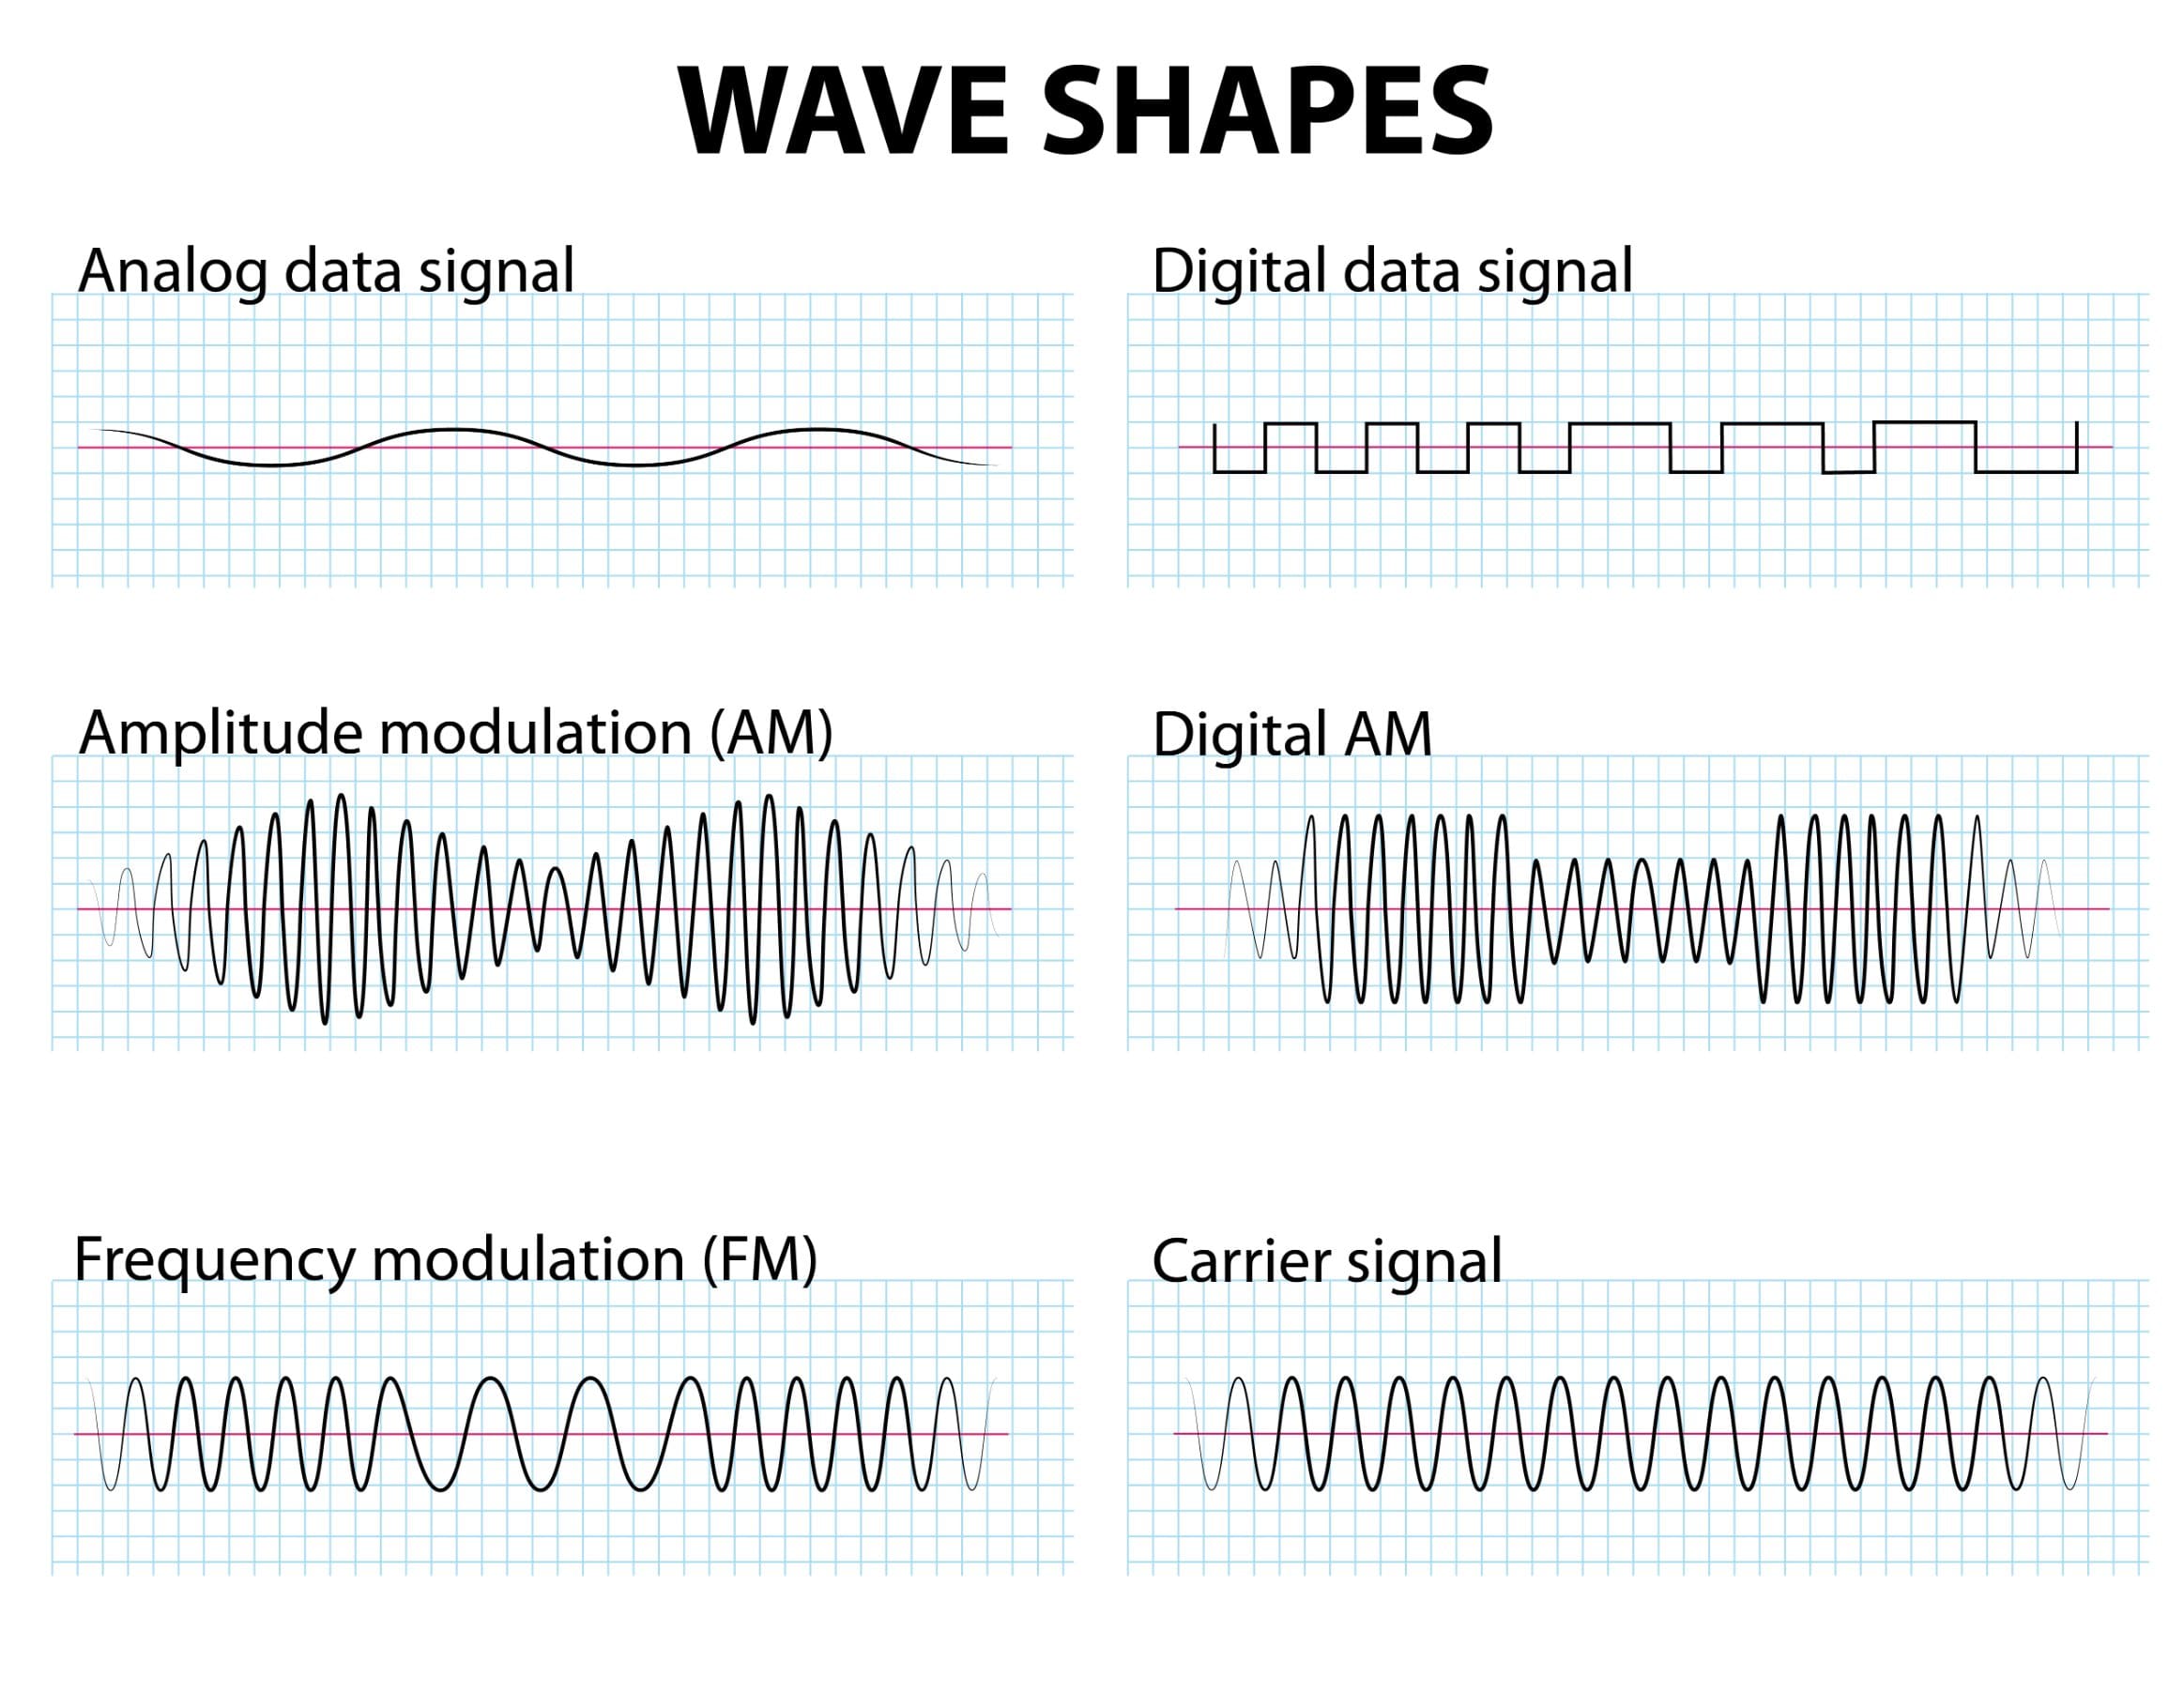
Wave shapes
Waves can take different forms and the shapes indicate their properties. The diagram below shows the various shapes that may appear in exam questions.

- Analogue data signal transmission is a method used to convey voice, data, image or video information using a continuous signal. The phase, amplitude or other properties may vary, however.
- Digital data signal refers to an electrical signal that is converted into a pattern of bits. Unlike an analogue signal (which is continuous) which contains changing quantities, a digital one has a discrete value at each sampling point.
- Amplitude modulation (AM) refers to a modulation technique and is often used in electronic communication. Often, it is via a radio carrier and the wave is varied in proportion to the waveform that is transmitted. This technique was one of the earliest forms of modulation and was used to transmit voice by radio.
- Frequency modulation (FM) is the modulation of a radio or other wave by varying its frequency, to enable it to carry an audio signal.
- A carrier signal is generally used in telecommunications and is a waveform that is modulated with an input signal for conveying information.
Describing waves
The behaviour of the waves can be described using key terms such as (time) period, frequency, amplitude and wavelength.
- The time period (or period) of a wave is defined as the time taken for one full cycle of a wave (including a peak and a trough) to pass, as shown in the diagram below:

- Frequency is defined as the number of complete waves passing the same point every second. A complete wave includes one peak and one trough.
Frequency can be calculated from the time period for the wave using the equation:
![\[ \text{frequency} = \frac{1}{\text{time period}} \]](https://env-onlinelearningcollege-gpclone.kinsta.cloud/wp-content/ql-cache/quicklatex.com-493d4b5472488c7d2af5a204be14b121_l3.png "Rendered by QuickLaTeX.com")
![\[ \text{f} = \frac{1}{\text{T}} \]](https://env-onlinelearningcollege-gpclone.kinsta.cloud/wp-content/ql-cache/quicklatex.com-4d552fe7459c76ebe4ac3349c9384201_l3.png "Rendered by QuickLaTeX.com")
Frequency is measured using the unit hertz (Hz) and the time period is measured in the unit seconds (s). Frequency is used as a measurement of the rate at which the waves are passing a specific point. As shown by the equation, if the time period over which one wave passes this point is increased, the frequency will decrease, meaning that fewer waves will pass the point every second.
If the time period is decreased, frequency will increase meaning that a higher number of waves can pass the point every second. When waves move through a medium, the particles in that medium oscillate. If the oscillations occur in the same direction and with the same displacement, the waves causing the oscillations are said to be in phase with each other.
A wave front is a line or plane along which the oscillations occur at the same distance from the source of the wave and are said to be in phase. If the waves are in phase, their action can be represented using a diagram such as the one below:

The vertical axis on the left represents the displacement of the particles caused by the oscillations of the waves. All waves move through an equilibrium or resting position where the particles of the medium are not oscillating. This is represented on the diagram as the straight horizontal line.
- Amplitude is defined as the maximum displacement of particles from their resting position caused by a wave. The point of maximum particle displacement caused by the wave oscillations is shown by the positions of the peaks. On the diagram, the amplitude can be measured as the distance between the peak and the resting position. The higher the peak, the more displacement has occurred and the higher the amplitude of the wave.
- Wavelength is defined as the distance between one point on a wave and the same point on the next wave. On the diagram, the wavelength can be measured as the distance between the peak of the first and the peak of the second wave.
The shorter the distance between the two points, the lower the value of the wavelength. The higher the distance measured between the two points, the higher the wavelength becomes. Frequency, wavelength and wave speed are all related, as shown by the wave equation:
![\[ \text{wave speed} = \text{frequency \times \text{wavelength}} \]](https://env-onlinelearningcollege-gpclone.kinsta.cloud/wp-content/ql-cache/quicklatex.com-b7619cad18d19be75fe9060bafadca41_l3.png "Rendered by QuickLaTeX.com")
![\[ v = f \times \lambda \]](https://env-onlinelearningcollege-gpclone.kinsta.cloud/wp-content/ql-cache/quicklatex.com-bc73cb1698da1866bbca25688fc8b83f_l3.png "Rendered by QuickLaTeX.com")
where wave speed is measured in metres per second (m/s), frequency is measured in hertz (Hz) and wavelength is measured in metres (m)
By considering the qualitative relationship between these three variables, we can see that, as the equation shows, an increase in one of the variables will lead to a direct change in one of the others. For example, if a source creating waves vibrates quickly, the wave speed increases. This means that the waves would move faster and the number of waves passing the point every second increases, therefore increasing the frequency. Increasing the wave speed causes the frequency to increase.
If the vibrations occur more slowly, the wave speed, number of waves produced each second and frequency all decrease. If we assume a constant wave speed, we can use the equation to show that as wavelength is decreased, the frequency increases.
This is because the amount of time taken for a wave with a longer wavelength to move past a specific point is higher than that taken for a wave with a shorter wavelength. This means that more of the waves with smaller wavelengths can pass a specific point every second. Therefore, for waves travelling at a constant speed, those with longer wavelengths have lower frequencies and those with a smaller wavelength have higher frequencies. You must know and be able to rearrange the wave equation as it will not be provided in the exam.
Measuring the speed of water waves
The speed of waves in water can be measured using a ‘ripple tank’. This is a piece of apparatus which demonstrates how water waves behave. In the exam you may be presented with a diagram or description of the ripple tank experiment, from which you must explain the behaviours of the ripples.
A ripple tank consists of a tank of water with a signal generator attached. There is a wooden bar or dipper attached to the signal generator which dips down into the water. When the power supply is turned on, the signal generator causes the wooden bar to vibrate and create a series of ripples on the surface of the water. Directly above the tank is a light which shines onto the water and reflects the pattern of the waves onto a piece of paper or film placed on the floor beneath the tank, so that the wave pattern can be observed.
The wave pattern observed can be used to investigate how the frequency affects wavelength by allowing the measurement of the distance between each wave.

The signal generator on the tank can be adjusted to produce a smaller or larger frequency. As the speed of the waves generated is constant, the lower the frequency, the longer the wavelength, and the higher the frequency, the shorter the wavelength.

